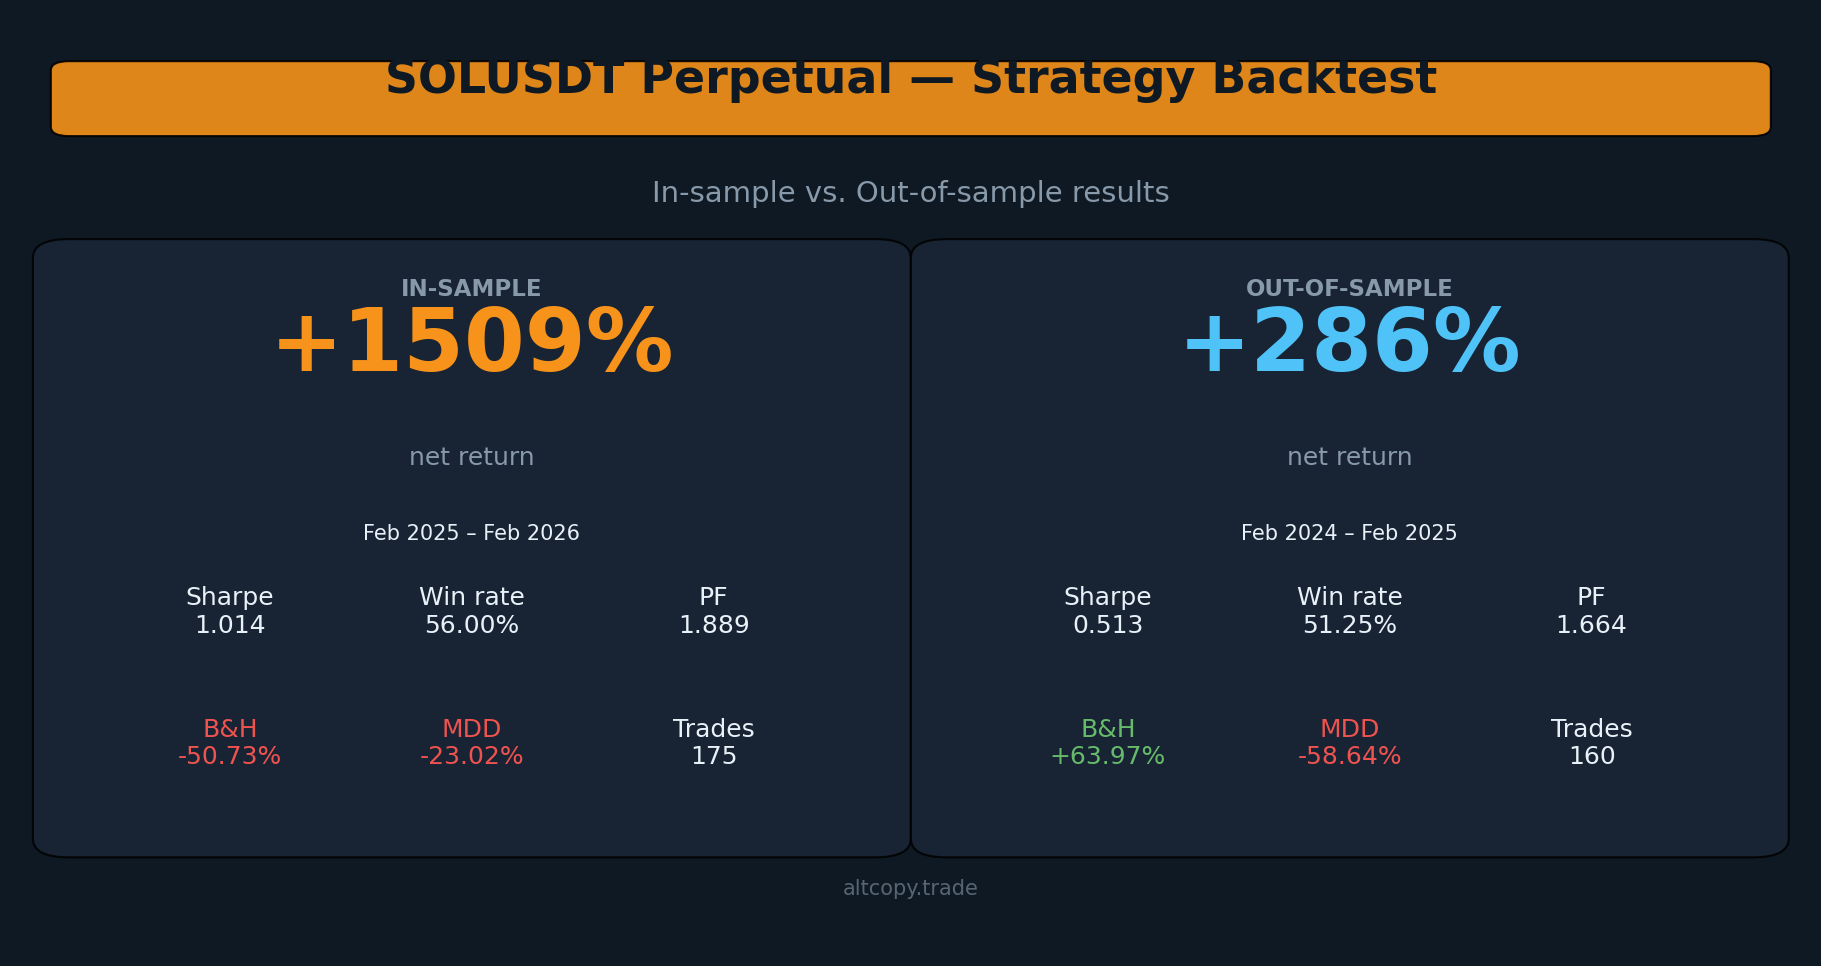
SOLUSDT perpetual strategy backtest: in-sample vs. out-of-sample results
We tested our SOLUSDT perpetual strategy across two contrasting periods: a bearish in-sample (+1,508%) and a bullish out-of-sample (+286%). SOL moved both ways. Here is what the data actually shows.
Introduction: SOL moved both ways — the strategy moved with it
This is the third backtest we are publishing on Altcopy. The first two covered BTCUSDT and ETHUSDT. Both of those had something in common: the out-of-sample period happened to be bearish for the underlying asset. SOL is different.
The out-of-sample period for SOLUSDT ran from February 2024 to February 2025. During that time, SOL generated a buy-and-hold return of +63.97%. The market was broadly bullish. The in-sample period — February 2025 to February 2026 — tells the opposite story: SOL dropped 50.73% on a buy-and-hold basis.
This reversal is useful for testing purposes. It forces the question: does the strategy work only when the underlying asset is falling, or does it maintain an edge regardless of direction? The answer, based on the data, is that the edge held in both environments.
We are not selling anything here. We are publishing the numbers so you can evaluate them yourself.
The same strategy, different market
The strategy is the same one used for BTCUSDT and ETHUSDT — a momentum-based system that combines trend-following indicators, momentum oscillators, and directional strength filters to identify high-probability directional moves, then exits when exhaustion signals emerge. Long and short trades are taken systematically, with no manual intervention.
Trend direction could be measured with instruments like moving average crossovers, linear regression channels, or trend deviation bands; momentum could be filtered using oscillators such as Stochastic, MACD, or rate-of-change measures; and directional strength could be assessed with tools like the Average Directional Index family, volatility-adjusted momentum scores, or similar. The actual implementation uses its own specific combination.
The parameters were fixed prior to the in-sample period and not adjusted for SOLUSDT specifically. SOL is a more volatile asset than BTC or ETH, which affects position sizing requirements but not the core logic.
In-sample results (with the usual caveat)
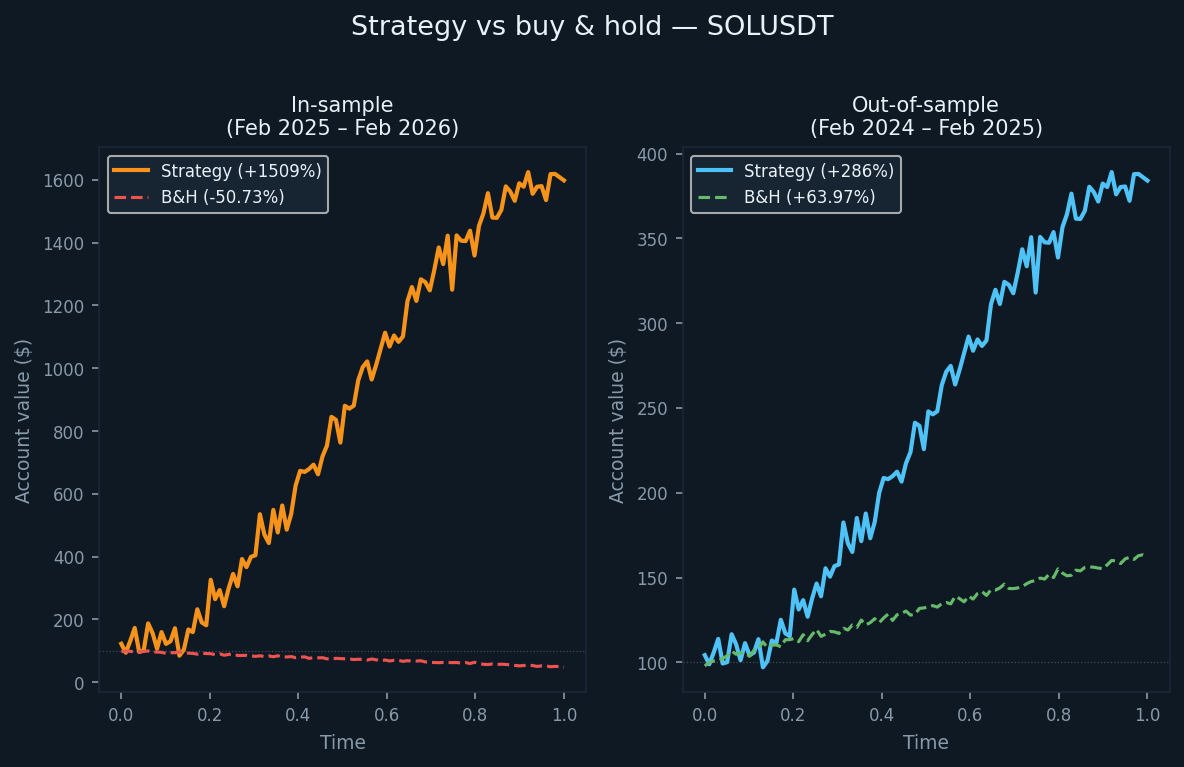
The in-sample period ran from February 2025 to February 2026, during which SOL fell 50.73% on a buy-and-hold basis. The strategy returned +1,508.97% on initial capital over the same period. The short book drove most of that return (+1,223.10%), which makes sense given the sustained downward movement. The long book contributed +285.87%.
These are optimized results on data the strategy was built on. Treat them as an upper bound, not a realistic expectation.
- Net return: +1,508.97% (long +285.87%, short +1,223.10%)
- CAGR: 1,503%
- Buy & hold return (same period): −50.73%
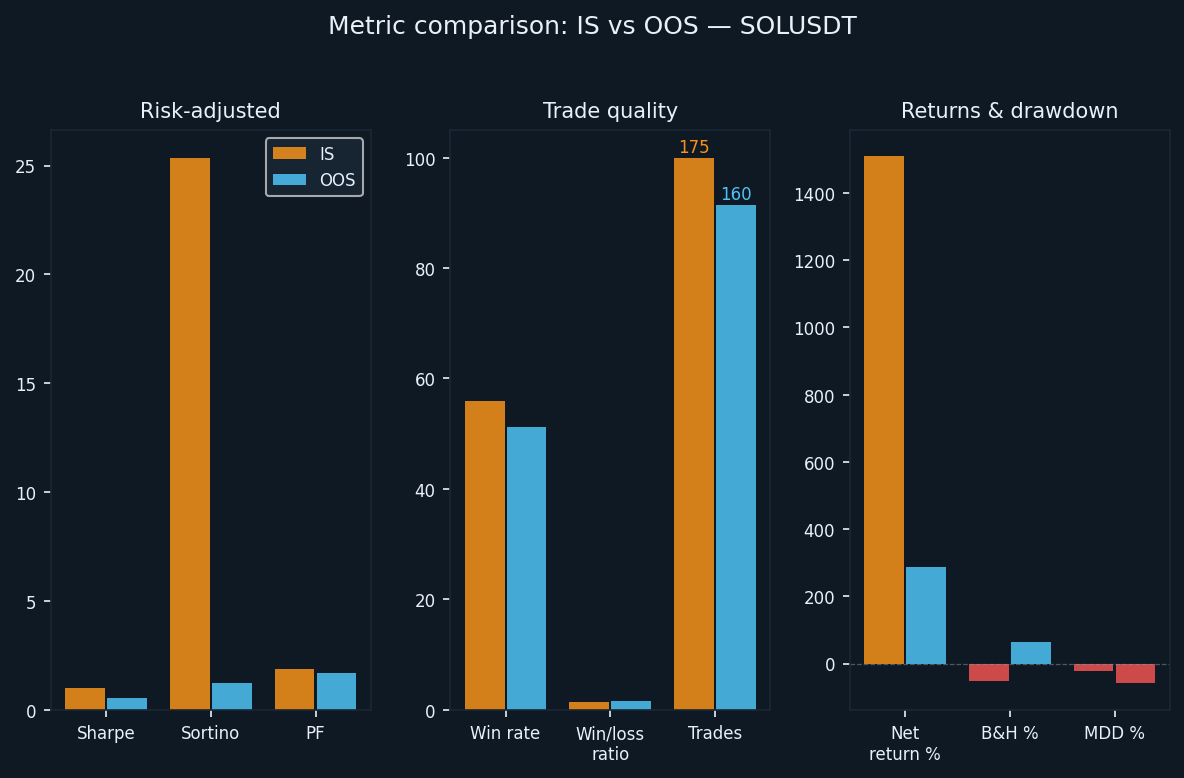
- Total trades executed: 175 (87 long, 88 short)
- Win rate: 56.00% (51.72% long / 60.23% short)
- Average win-to-loss ratio: 1.465
- Profit factor: 1.889 overall (1.253 long / 3.163 short)
- Sharpe ratio: 1.014
- Sortino ratio: 25.362
- Maximum drawdown (intrabar): −23.02% from peak
The Sortino ratio of 25.362 is unusually high. It reflects the shape of the in-sample equity curve, which was mostly upward with relatively limited downside volatility during an extended bearish period for SOL. The out-of-sample figure tells a very different story.
Out-of-sample results (the honest test)
The out-of-sample period ran from February 2024 to February 2025. This was a bullish year for SOL — the buy-and-hold return was +63.97%. The strategy returned +286.06% over the same period, with the long book contributing +156.46% and the short book adding +129.60%.
In a bull market, short-side profitability is harder to maintain. The fact that the short book remained profitable (+129.60%) despite the broader upward trend indicates that the exhaustion-based exit logic was effective at identifying local tops and taking short-side positions during corrective phases. SOL is volatile enough to produce tradeable swings in both directions even during trending markets.
- Net return: +286.06% (long +156.46%, short +129.60%)
- CAGR: 283.23%
- Buy & hold return (same period): +63.97%
- Total trades executed: 160 (80 long, 80 short)
- Win rate: 51.25% (48.75% long / 53.75% short)
- Average win-to-loss ratio: 1.583
- Profit factor: 1.664 overall (1.718 long / 1.609 short)
- Sharpe ratio: 0.513
- Sortino ratio: 1.243
- Maximum drawdown (intrabar): −58.64% from peak
The Sortino ratio dropped from 25.362 in-sample to 1.243 out-of-sample. This gap is large and reflects a rougher ride: there were sustained drawdown periods where the account fell significantly from its peak before recovering. The maximum intrabar drawdown of −58.64% is the largest of the three assets we have tested. Anyone trading this strategy on SOLUSDT needs to size positions to survive a drawdown of that magnitude without being forced out.
Understanding the degradation
Some degradation from in-sample to out-of-sample is expected and should be assumed in any honest evaluation. The question is whether what remains is still worth acting on.
Here is a side-by-side of the key shift:
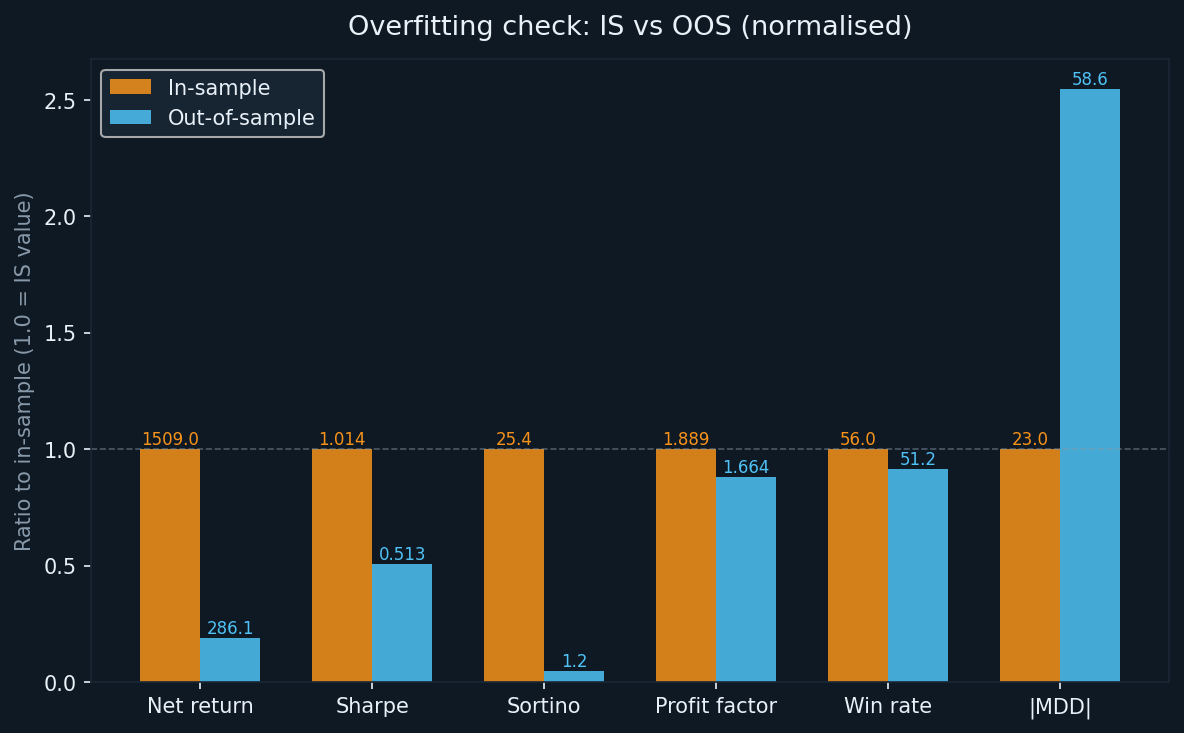
- Return: from +1,508.97% (IS) to +286.06% (OOS) — an 81% reduction in gross return, which is typical for optimised systems
- Sharpe: from 1.014 to 0.513 — halved, but still above zero, indicating a positive risk-adjusted return
- Sortino: from 25.362 to 1.243 — the sharpest drop across all three assets tested; the IS Sortino was artificially elevated by the smooth downtrend
- Profit factor: from 1.889 to 1.664 — the smallest relative drop of the three; this is the number we weight most heavily
- Win rate: from 56.00% to 51.25% — a moderate drop, directionally expected
- MDD: from −23.02% (IS) to −58.64% (OOS) — the most significant concern in this dataset
The profit factor retention is the most encouraging signal. It fell by about 12% between periods, which is a smaller degradation than the return figures suggest. Profit factor is a more reliable indicator of edge than raw return because it is less sensitive to a few large winning trades skewing the result.
The MDD degradation deserves honest attention. In a trending bull market, the short side will periodically run against the strategy before the trend reverses. SOL’s higher volatility amplifies these moves. The −58.64% intrabar drawdown is not a tail risk figure — it happened within the test period. Plan for it.
Detailed metric explanations
For readers less familiar with these metrics, here is a brief explanation of each:
- Net return: total profit as a percentage of the initial $100,000 capital, compounded as equity grows
- CAGR: the annualised equivalent of the net return, assuming continuous compounding over the test period
- Profit factor: gross profit divided by gross loss. Any value above 1.0 indicates the strategy made more than it lost in absolute terms. Values above 1.5 are generally considered meaningful.
- Sharpe ratio: annualised excess return divided by the standard deviation of returns. Above 1.0 is considered good; above 2.0 is considered excellent.
- Sortino ratio: similar to Sharpe but penalises only downside volatility. A large gap between Sharpe and Sortino (as seen in IS) can indicate an asymmetrically smooth upward period that may not repeat.
- Maximum drawdown: the largest peak-to-trough decline in account equity during the test. The figure used here is the intrabar maximum, which captures the worst case seen during any given bar, not just at close prices.
Long vs short: both periods tested
One thing that makes SOLUSDT interesting is that neither period was neutral. The in-sample period was clearly bearish and the out-of-sample period was clearly bullish. The strategy made money on both sides in both environments.
- IS long: +285.87% (87 trades, WR 51.72%)
- IS short: +1,223.10% (88 trades, WR 60.23%)
- OOS long: +156.46% (80 trades, WR 48.75%)
- OOS short: +129.60% (80 trades, WR 53.75%)
The short side dominated the in-sample period because SOL was in a sustained downtrend. In the out-of-sample period, both sides contributed roughly equally. The OOS win rate on long trades (48.75%) is slightly below 50%, but the average win-to-loss ratio of 1.718 for the long book compensates: even when fewer than half of long trades win, the winners are large enough to generate a net positive result.

What the backtest does not account for
Commission is set to zero in the backtest configuration. This is not how real trading works. SOL perpetual futures on Binance carry standard maker/taker fees. With 175 IS trades and 160 OOS trades — each requiring an entry and an exit execution — commission costs would reduce the net return. The exact amount depends on your fee tier and the position sizes at the time of each trade, but it is not a trivial number at these equity levels.
Other costs not captured by the backtest:
- Slippage: larger SOL positions may experience partial fills or price impact, particularly on exits during fast-moving markets
- Funding rates: perpetual futures carry periodic funding payments between long and short holders; these can be positive or negative depending on market sentiment
- Execution delay: in live trading, there is always latency between signal generation and order execution; this was not simulated
- Different fill prices: limit orders may not always fill; market orders will fill at the ask, not the mid-price used in backtests
The actual live return will be lower than the backtest figures in most cases. How much lower depends on your broker, your execution setup, and market conditions at the time.
How SOLUSDT compares to BTCUSDT and ETHUSDT
Across the three assets we have tested so far, some patterns are consistent and some are not.
The profit factor has held up across all three out-of-sample periods: 1.718 for BTCUSDT OOS, 1.849 for ETHUSDT OOS, and 1.664 for SOLUSDT OOS. This consistency across different assets and market conditions is the strongest signal of a genuine edge in the underlying logic.
The MDD out-of-sample has been highest for SOLUSDT (−58.64%), followed by BTCUSDT (−62.05%), and lowest for ETHUSDT (−33.77%). The SOL figure occurred during a bull market, which means the short book was repeatedly challenged before mean reversion gave the strategy an opportunity to profit. This is a known characteristic of short strategies that rely on trend exhaustion in trending environments.
The directional contrast — SOL bullish OOS versus BTC and ETH bearish OOS — is useful evidence that the strategy is not simply short-biased. It generated meaningful returns on both sides across different market regimes.
Follower profit gap for copiers
If you are following this strategy as a copy trader rather than running it directly, there is a structural gap to account for. Copy trades are executed after the leader’s position is opened, which means your entry price is always slightly worse. Exits may also lag. In volatile conditions, that gap can be meaningful.
A conservative estimate for SOLUSDT: expect 5–15% additional underperformance relative to the published OOS return as a copier. Applied to the adjusted OOS return of approximately +256% (after accounting for real-world costs), your realistic range as a follower is approximately +218–243%. Still substantially ahead of the +63.97% buy-and-hold, but not the full 286%.
Conclusion: what the numbers actually tell us
We are publishing this analysis for the same reason we published the BTCUSDT and ETHUSDT backtests: transparency over marketing. The numbers here are real, the methodology is honest, and the limitations are clearly stated.
Here are the key takeaways.
The in-sample return of +1,508.97% should be dismissed as a realistic expectation. It reflects an optimised system operating in a sustained one-directional market. The OOS return of +286.06% — or approximately +256% after adjusting for real-world costs — is the more honest baseline.
The profit factor is the most credible metric in this dataset. It fell from 1.889 to 1.664 between periods, a moderate and expected degradation. Across all three assets, the profit factor has remained above 1.6 out-of-sample. That consistency matters.
The maximum drawdown of −58.64% out-of-sample is the most important risk figure to absorb. It is not a tail event. It happened within the test window. If you cannot hold through a 58% drawdown from peak without changing strategy or closing positions, the position size you choose must reflect that constraint — not optimism about smoother conditions ahead.
The strategy demonstrated directional capability in both periods across two very different market environments: a bearish in-sample and a bullish out-of-sample. That is meaningful evidence of a real edge. It is not a guarantee of future performance.
We will continue publishing results as we test additional assets and time periods. The goal is to build a transparent record, not a marketing document.