Meet the details of the new BTCUSDT strategy we are testing
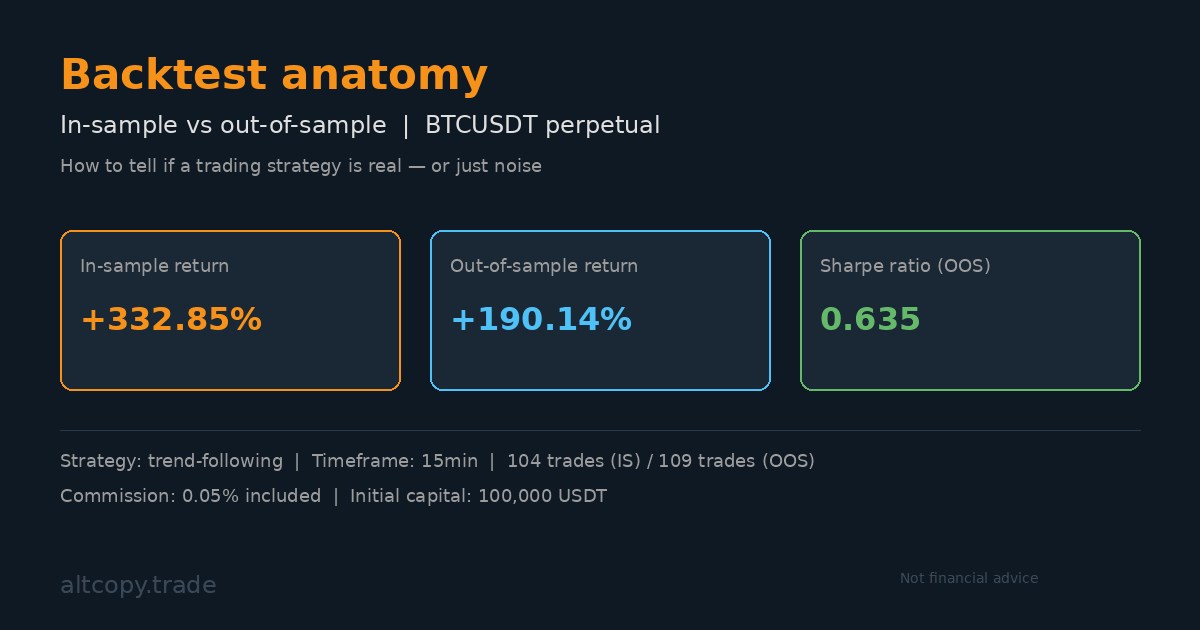
BTCUSDT perpetual futures: +332% in-sample, +190% out-of-sample. A transparent breakdown of how we study strategies before they reach production — including what the backtest doesn’t tell you.
Introduction: why you should distrust pretty numbers
Anyone can show you a +332% backtest result. The numbers look incredible on a PowerPoint slide: a green curve climbing steeply upward, month after month of gains, a return that makes traditional investors weep with envy. But here's the uncomfortable truth that most traders hide: those numbers were generated by a strategy that saw every trade before it happened.
This is what we call the backtest illusion. A trading strategy can be fine-tuned, parameter by parameter, until it fits historical data perfectly. But fitting historical data perfectly is not the same as trading profitably in the future. The real question is not "How much did this strategy make when we optimized it on data we already knew?" The real question is "How much would it make on data it has never seen?"
This post is our attempt to answer that second question honestly. We are testing one of several possible strategies we are evaluating, and we are sharing not just the headline numbers but the full lab notes: where the strategy performs, where it struggles, what the backtest doesn't tell you, and how you should adjust your expectations if you actually trade this.
Let's start with the fundamentals.
What is a backtest?
A backtest is a simulation. You take a trading strategy, you apply it to historical price data, and you measure: Did it make money? How often did it win? What was the worst drawdown? It is like replaying a chess game where you already know all of your opponent's moves and can adjust your play accordingly.
The usefulness of a backtest is real but limited. It tells you whether a strategy's core logic is sound. It shows you what a strategy might look like in practice: the frequency of trades, the average profit per trade, the size of drawdowns, the ratio of wins to losses. For someone building a strategy, this information is invaluable. You can quickly discard ideas that fail the backtest and focus on ideas that have merit.
But here is where backtests become dangerous: traders often treat backtest results as predictions of future performance. They don't. A backtest shows you what happened in the past. The future, unfortunately, has not happened yet.
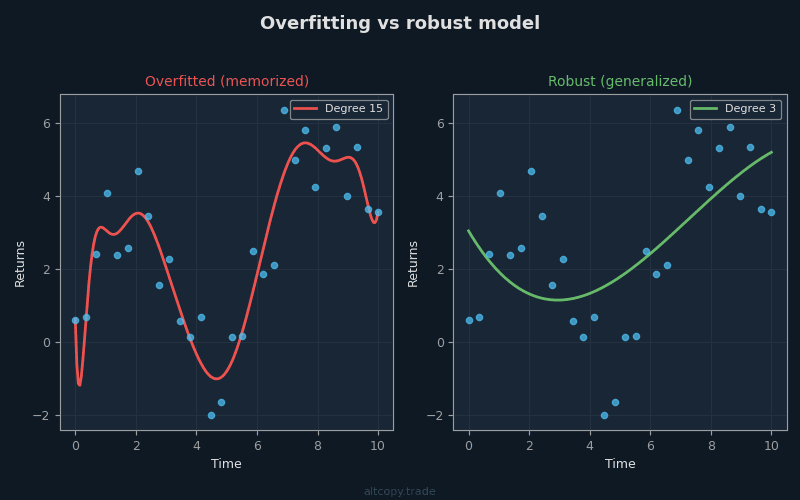
The overfitting problem
Imagine a student preparing for an exam. The teacher gives the class ten past exams to study. The student does not merely study the concepts—the student memorizes every single question, every answer, every explanation. On exam day, if the teacher recycles those same ten questions, the student scores a perfect 100%. But when the teacher writes a new exam with questions the student has never seen, the student fails miserably.
This is overfitting. It happens when a model learns the noise in the training data instead of learning the underlying pattern. In trading, overfitting happens when you optimize a strategy's parameters until it fits historical data perfectly. You tweak a threshold here, adjust a lookback period there, test a hundred different combinations until one of them generates a +332% return. You have not found a profitable strategy. You have found a strategy that is exquisitely tuned to the specific noise of the past.
The danger is that an overfitted strategy will fail as soon as the market conditions shift slightly. The price ranges it optimized for no longer occur. The volatility changes. The trend structure evolves. The strategy that made 332% on historical data now makes 2% or loses 50% on new data.
This is why we test strategies on data they were not trained on. It is the only way to know if the strategy learned something real.
In-sample vs out-of-sample: the honest test
There are two types of data in strategy testing:
In-sample (IS) data is the data the strategy was trained on. For this strategy, the in-sample period runs from February 2025 to February 2026. This is the historical data we used to build and optimize the strategy. We saw every trade. We adjusted parameters. We refined the logic. Every number in the in-sample backtest is, to some degree, contaminated by hindsight.
Out-of-sample (OOS) data is completely different. It is data from the past, from February 2024 to February 2025—the period before we built the strategy. The strategy has never seen this data. When we apply the strategy to out-of-sample data, we are asking: "If this strategy had existed last year, would it have made money on data it was never optimized for?" This is the honest test. This is what matters.
The gold standard in strategy research is to test on out-of-sample data that is far enough in the past that you could not possibly have known about it when you built the strategy. If a strategy performs well on this data, you have evidence that it learned something real, not just overfitted to recent noise.
The strategy in summary
We will not reveal specific indicator names. Instead, here is what the strategy does at a high level:
This is a trend-following strategy that trades BTCUSDT perpetual futures on a 15-minute timeframe. It uses trend-detection algorithms to identify the direction of the market—is Bitcoin moving up or down? Once a trend is identified, momentum filters confirm that the move has genuine strength. If the momentum is weak, the strategy waits. If momentum is strong, it enters a position.
As a trend progresses, exhaustion signals monitor for the moment when the trend is losing steam. These signals do not predict reversals with certainty—nothing does—but they alert the strategy when a trend may be approaching its end. The strategy can then exit before the reversal hits hardest.
The strategy is always in the market, always holding either a long position or a short position. There are no idle periods. It does not pyramid into positions—each trade is sized at 100% of available equity. Commission is fixed at 0.05% per trade, and this cost is already deducted from all numbers you see in this post.
In-sample results (with a major caveat)
Warning: These numbers are inflated because the strategy was optimized on this data.
In-sample period: February 2025 – February 2026
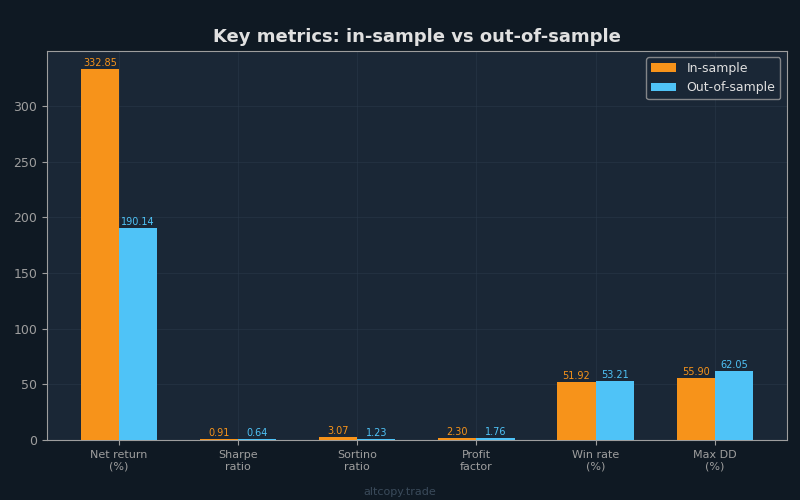
- Net return: +332.85% (equivalent to +332,853 USDT profit on an initial 100,000 USDT account)
- CAGR (compound annual growth rate): 331.63%
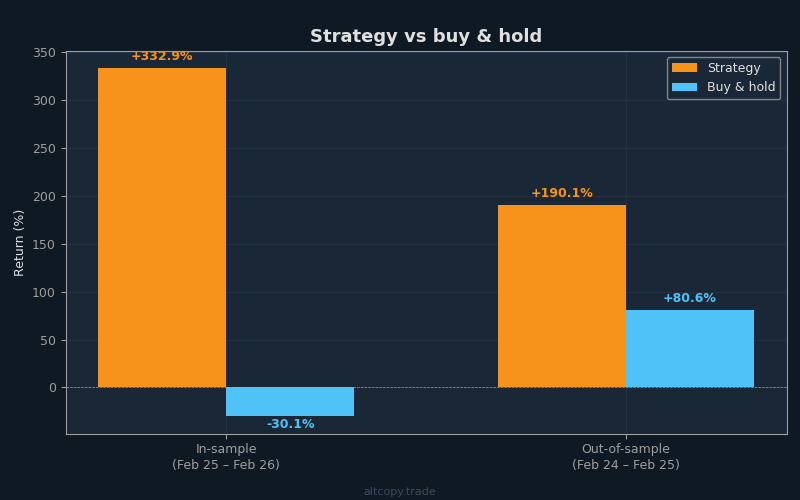
- Buy & hold return (BTC only): −30.11% (Bitcoin actually fell during this period)
- Strategy outperformance: +362,961 USDT above buy & hold
- Total trades executed: 104 (52 long, 52 short)
- Win rate: 51.92%
- Average win-to-loss ratio: 2.13x (winning trades average 2.13 times larger than losing trades)
- Profit factor: 2.30 (total gross profit divided by total gross loss)
- Sharpe ratio: 0.906
- Sortino ratio: 3.074
- Maximum drawdown (peak-to-trough): −55.90%
- Total commission paid: 28,003 USDT (already deducted from net return)
The in-sample period is a mixed environment for trend following. Bitcoin fell 30% overall, creating a strong downtrend for much of the period. A strategy that is optimized on data always benefits from knowing exactly where the turning points were. Do not take these numbers as a reliable forecast of future performance. Take them as evidence that the strategy's logic is not obviously broken.
Out-of-sample results (the real test)
Out-of-sample period: February 2024 – February 2025
- Net return: +190.14% (equivalent to +190,143 USDT profit on 100,000 USDT initial capital)
- CAGR: 188.46%
- Buy & hold return: +80.58% (Bitcoin was in a strong bull market)
- Strategy outperformance: +109,568 USDT above buy & hold
- Total trades executed: 109 (55 long, 54 short)
- Win rate: 53.21% overall (long trades: 58.18%, short trades: 48.15%)
- Average win-to-loss ratio: 1.544x
- Profit factor: 1.756
- Sharpe ratio: 0.635
- Sortino ratio: 1.227
- Maximum drawdown: −62.05%
- Total commission paid: 17,036 USDT (already deducted)
This is what matters. The out-of-sample test applies the strategy to data it was never optimized on. The strategy had no knowledge of these price movements when it was being built. The +190.14% return is real evidence that the strategy's logic—its trend detection, its momentum filtering, its exhaustion signals—learned something genuinely useful about Bitcoin price action.
Notice also that the strategy significantly outperformed buy & hold even in a bullish environment. Bitcoin rose 80.58%, but the strategy rose 190.14%. This is notable because uptrends favor simple buy-and-hold. A strategy that can beat buy & hold in a strong bull market has demonstrated genuine value.
Detailed metric explanations
For traders new to strategy evaluation, the numbers above need context. Let's break down the most important metrics:
Sharpe Ratio (In-Sample: 0.906, Out-of-Sample: 0.635): The Sharpe ratio measures return per unit of risk. It tells you how smooth the journey to your profits was. In-sample, the strategy delivered 0.906 units of return for each unit of volatility endured. Out-of-sample, that fell to 0.635. For cryptocurrency trading, above 0.5 is considered decent. Above 1.0 is excellent. Think of Sharpe as "how comfortable was the ride to profit?" A high Sharpe means you made money without wild swings. A low Sharpe means you made money but with heart-stopping drawdowns.
Sortino Ratio (In-Sample: 3.074, Out-of-Sample: 1.227): The Sortino is like Sharpe's wiser sibling. It only penalizes downside volatility—drops in your account value—while ignoring upside volatility. A high Sortino means you experienced big profits but fewer or smaller losses. The out-of-sample Sortino of 1.227 is solid; the in-sample 3.074 is exceptional. The gap between them reflects the reality that the in-sample period had more favorable conditions for this particular strategy.
Profit Factor (In-Sample: 2.30, Out-of-Sample: 1.756): This is gross profit divided by gross loss. Above 1.0 means you made more than you lost. Below 1.0 means you are losing money. Above 1.5 is healthy. Above 2.0 is very healthy. The out-of-sample profit factor of 1.756 means that for every dollar the strategy lost, it made $1.756 on average. This is healthy, though not exceptional.
Win Rate (In-Sample: 51.92%, Out-of-Sample: 53.21%): The win rate is the percentage of trades that were profitable. Above 50% is breakeven; above 55% is good. The strategy hovers right around 52–53%, which means slightly more than half of trades made money. Do not overweight this metric. What matters more than how often you win is how much you win when you do win versus how much you lose when you do lose. A 40% win rate with a 4:1 win-to-loss ratio is better than a 60% win rate with a 1:1 ratio. This strategy's win rate is modest, but its win-to-loss ratio compensates.
Maximum Drawdown (In-Sample: −55.90%, Out-of-Sample: −62.05%): This is the worst peak-to-trough decline. Imagine your account reaches a peak of $150,000. Then markets reverse, and your account drops to $56,400. That is a −62% drawdown. This is the pain threshold. If you trade this strategy and it experiences a −62% drawdown, at some point you will have seen your account lose more than half its value from its peak. Can you tolerate that? Most retail traders cannot. This is a critical reality check.
Degradation between periods
Compare the two periods and you see degradation:
- Return: from +332.85% (IS) to +190.14% (OOS) = −43% degradation
- Sharpe: from 0.906 (IS) to 0.635 (OOS) = −30% degradation
- Sortino: from 3.074 (IS) to 1.227 (OOS) = −60% degradation
Is this degradation a red flag? Surprisingly, no. In fact, significant degradation is expected and actually healthy. If out-of-sample results matched in-sample results perfectly, that would be a sign of either luck or overfitting. Real strategies degrade because market conditions change. The volatility profile shifts. The trend structure evolves. A strategy optimized for one regime will naturally perform differently in another.
What would be suspicious is if degradation were extreme—say, +332% in-sample and −50% out-of-sample. That would suggest severe overfitting. Our degradation pattern (returning 190% out-of-sample from 332% in-sample) falls into the normal range for trend-following strategies. It is neither shocking nor concerning.
Long vs short in different market regimes
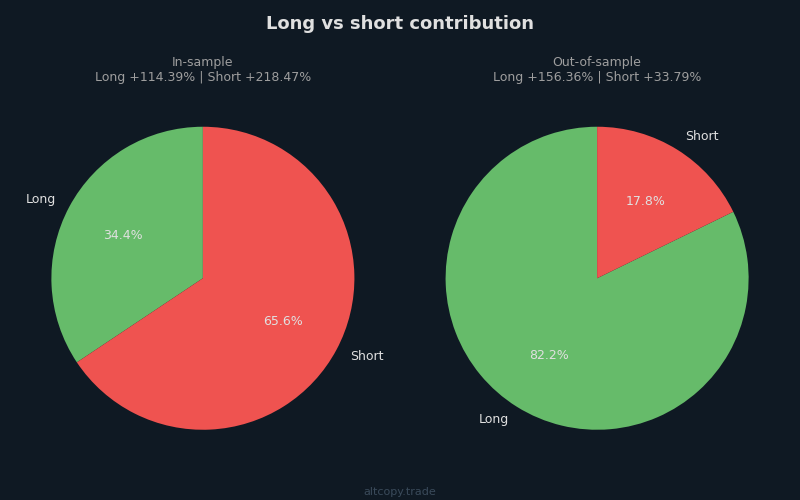
A critical insight emerges when you break down performance by direction:
In the in-sample period (February 2025 – February 2026, bearish Bitcoin: −30% B&H): The short side contributed +218% of the total return. The long side contributed +114%. This makes sense. Bitcoin was falling, and the strategy correctly identified and rode the downtrend. The strategy's ability to short effectively in a bear market is valuable because it demonstrates the strategy is not biased toward one direction.
In the out-of-sample period (February 2024 – February 2025, bullish Bitcoin: +81% B&H): The long side contributed +156% of the return. The short side contributed +34%. The strategy correctly shifted to favor long positions when Bitcoin was in a bull market. Even the short side remained profitable, which is encouraging—it means the strategy's short logic is not just a liability during bull markets but can still capture opportunities.
This asymmetry between periods is precisely what you want to see in an out-of-sample test. It shows the strategy is not curve-fit to one market condition. It adapts. In a bear, it shorts. In a bull, it longs. A strategy that had the same long-to-short breakdown in both periods would suggest it was overoptimized for a specific regime.
What the backtest does not account for
Here is where dreams collide with reality. The backtest is a simulation running on perfect data with perfect execution. Real trading does not work that way. There are several costs and frictions that the backtest does not capture:
Slippage (Estimated Cost: ~17,010 USDT / 17.01% of initial capital): Slippage is the difference between the price you see and the price you actually get when you execute a trade. You identify an entry point on the chart and send a buy order. By the time your order reaches the exchange, the price has moved 0.04%. You get filled at a worse price. This happens on every trade. Over 109 trades × 2 executions per trade (entry and exit) = 218 executions, with an average position size of ~195,071 USDT and conservative slippage of 0.04% per side, the total slippage cost compounds to approximately 17,010 USDT. This is the hidden tax of real trading. The backtest assumes you execute at the exact candle close price, which does not happen.
Funding Rates (Estimated Net Cost: ~4,146 USDT / 4.15% of initial capital): Perpetual futures have funding rates—interest payments that long and short position holders exchange every 8 hours (or daily, depending on the exchange). When Bitcoin is in a strong uptrend, funding rates are positive, and long position holders pay short position holders. In a downtrend, it reverses. The backtest does not model these funding payments. In the out-of-sample period, Bitcoin was bullish, so long positions paid funding and short positions received it. We estimate the net funding cost at ~4,146 USDT, assuming 20% of costs are offset by funding received during the bullish period.
Infrastructure Costs: This strategy trades 24/7 on 15-minute candles. You cannot run your laptop for a year and expect it to survive. You need a dedicated server, monitoring systems, redundancy, and backup. These costs are real. A basic setup: $500–1,000 per year. If you scale, the costs scale with you.
Commission (Already Included: 17,036 USDT / 17.04% of initial capital): This is the one cost the backtest already includes. We have already deducted 0.05% per trade from all reported numbers. But we mention it here for completeness.
Let's recalculate the out-of-sample return after accounting for the costs the backtest missed:
- Gross out-of-sample return (from backtest): +190.14%
- Less: Slippage estimate: −17.01%
- Less: Funding rate estimate: −4.15%
- Adjusted out-of-sample return: ~+168.98%
- Buy & hold (same period): +80.58%
- Adjusted alpha (excess return): +88.40 percentage points above buy & hold
This adjusted return of ~169% is significantly lower than the headline 190% from the backtest, but it is still more than double the buy & hold return of 81%. The strategy would need to be dramatically more inefficient in execution to erase this edge.
Does the margin cover additional costs vs spot?
You might ask: Why use perpetual futures with all these hidden costs when you could just buy Bitcoin spot and hold it?
The answer is in the numbers. Spot Bitcoin returned +80.58% passively. The strategy, after adjusting for slippage, funding, and commission, returned ~+169%. The strategy generated ~88 percentage points of additional return. That extra alpha has to cover not just the slippage and funding we estimated, but also:
- Infrastructure costs (~$500–1000/year)
- Higher slippage than estimated (if your execution is slower)
- Psychological costs of enduring −62% drawdowns
The math suggests yes, the margin is there. An 88-point edge is substantial enough to absorb reasonable execution inefficiencies. But the margins are not as wide as they initially appear. This is not a strategy that will make you wealthy if execution is sloppy.
Follower profit gap for copiers
If you are tempted to copy this strategy through a platform like Bitget or Bybit, understand one reality: the leader's returns are not your returns.
When you copy a strategy on a third-party platform, your execution lags the leader. The leader exits their short at price 42,500. By the time the signal propagates to your account and your order executes, Bitcoin is trading at 42,450. Your fill is worse. Over hundreds of trades, this lag compounds into substantial performance degradation.
Additional sources of slippage for copiers:
- Execution delay (1–10 seconds lag between leader and follower)
- Different fill prices (your market orders fill at different prices than the leader's)
- Minimum order size rounding (if you are copying with less capital, position sizing may not scale linearly)
- Platform-specific fees (copying fees on top of commission)
Conservative estimate: expect 5–15% additional performance degradation as a copier. If the leader's expected return is ~169%, your expected return as a copier is ~144–161%. Still ahead of buy & hold, but not by as much as the backtest suggests.
Conclusion: what this means
Why do we share all of this openly instead of keeping it proprietary? Because this is not marketing material. This is research. This is a transparent look at how we build, test, and evolve trading strategies before they enter production.
Most trading educators and strategy sellers show you the highlight reel: the headline return, the Sharpe ratio, the win rate. They gloss over the drawdowns, ignore the hidden costs, and never show you how the strategy performs on data it was never optimized for. We are doing the opposite. We are showing you the lab notes.
Here are the key takeaways:
The in-sample return of +332% is inflated. It represents what the strategy would have done if we could replay history knowing every turning point. The realistic expectation is the out-of-sample return of +190%, and after adjusting for hidden costs like slippage and funding, closer to +169%.
Even after adjustments, +169% out-of-sample is substantially better than the +81% buy & hold return. The strategy earned an additional ~88 percentage points of alpha. But margins are tighter than they initially appear, and execution quality matters enormously.
The strategy's primary strength is not explosive returns. It is downside protection. In the in-sample period, Bitcoin fell 30% while the strategy gained 333%. In the out-of-sample period, the strategy outpaced a strong bull market by 88 points after costs. This asymmetry—outperforming in both up and down markets—is the true value proposition. Buy & hold exposes you to directional risk. This strategy hedges that risk.
The −62% maximum drawdown is real. There will come a point where your account is down more than half from its peak. If you cannot tolerate that emotionally, this strategy is not for you, no matter how good the returns look.
This is one of several strategies we are evaluating. It has merit, but no single strategy is a silver bullet. We are building a diversified approach that combines multiple strategies with different characteristics—some trend-following, some mean-reversion, some volatility-based. The goal is to improve both returns and stability.
Finally, the most important takeaway: Past backtests, even out-of-sample ones, do not predict the future. This is research, not a promise. Markets evolve. Regimes change. What works in a specific historical period may fail in the next one. We have shown you the evidence, but evidence of past performance is the opposite of a guarantee of future performance.