ETHUSDT perpetual strategy backtest: in-sample vs. out-of-sample results
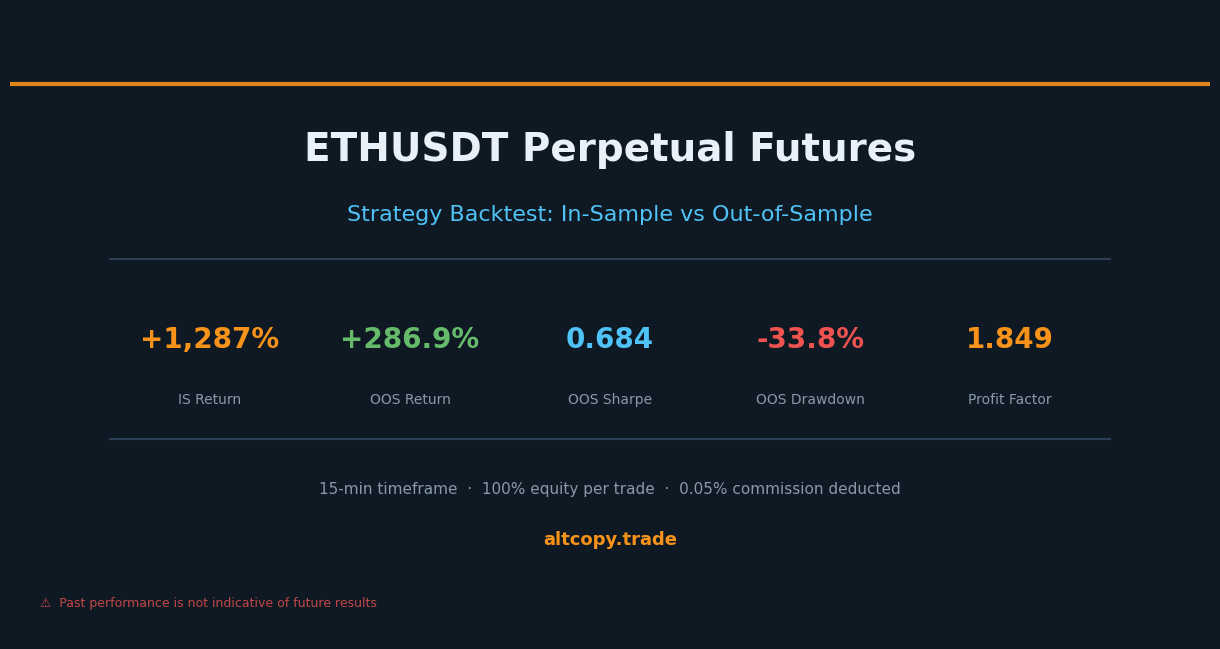
We ran our ETHUSDT perpetual strategy through an honest two-period backtest. In-sample: +1,287%. Out-of-sample: +286.85% — against a -7.2% buy-and-hold. Here is what the numbers actually mean, and what they do not.
Introduction: when Ethereum falls, the strategy keeps working
There is a specific kind of market that exposes weak strategies quickly: a prolonged bear. When prices fall month after month, long-only strategies collapse. Buy-and-hold investors watch their portfolios shrink. And strategies that were optimized during a bull market suddenly fail to adapt.
The ETHUSDT backtest we are sharing today is unusual because both testing periods — the in-sample period used to build the strategy and the out-of-sample period used to test it — were bearish for Ethereum. In-sample, ETH fell 30.15%. Out-of-sample, ETH fell another 7.2%. And in both periods, the strategy made money.
That is not a coincidence. That is what a two-directional strategy is supposed to do.
This post follows the same format as our BTCUSDT analysis: we show you every number, explain every metric, and account for every cost the backtest does not capture. The goal is not to impress you. The goal is to give you enough information to evaluate this strategy honestly.
The same strategy, different asset
This is the same trend-following framework applied to ETHUSDT perpetual futures on a 15-minute timeframe. The core logic is unchanged: trend-detection algorithms identify directional bias, momentum filters confirm whether a move has genuine strength, and exhaustion signals alert the strategy when a trend may be approaching its end.
The strategy is always long or short — no idle periods. Position size is 100% of available equity per trade. Commission is 0.05% per trade, already deducted from all results you see here.
The reason we test the same strategy on multiple assets is straightforward: a strategy that only works on one instrument may have been tuned to the idiosyncrasies of that instrument. A strategy that works on both Bitcoin and Ethereum, in different market regimes, is more likely to have captured something genuine about how trend-following works in crypto markets.
In-sample results (with the usual caveat)
Warning: these numbers are inflated because the strategy was optimized on this data.
In-sample period: February 2025 – February 2026
- Net return: +1,287.10% (equivalent to +1,287,095 USDT profit on an initial 100,000 USDT account)
- CAGR (compound annual growth rate): 1,277.16%
- Buy & hold return (ETH only): -30.15% (Ethereum fell during this period)
- Strategy outperformance: +1,317,244 USDT above buy & hold
- Total trades executed: 162 (81 long, 81 short)
- Win rate: 58.02% (long trades: 55.56%, short trades: 60.49%)
- Average win-to-loss ratio: 1.375x (winning trades average 1.375 times larger than losing trades)
- Profit factor: 1.901 (total gross profit divided by total gross loss)
- Sharpe ratio: 1.349
- Sortino ratio: 12.81
- Maximum drawdown (peak-to-trough): -25.53%
- Total commission paid: 102,195 USDT (already deducted from net return)
The in-sample Sortino ratio of 12.81 is extraordinarily high. Numbers above 3.0 are exceptional; 12.81 is in territory rarely seen outside of highly optimized backtests. This is a strong signal that the in-sample period represents overfitting at work. The strategy had access to exactly the right data to produce exceptional downside-adjusted returns. Do not treat this number as realistic. Watch what happens to it in the out-of-sample period.
Out-of-sample results (the honest test)
Out-of-sample period: February 2024 – February 2025
- Net return: +286.85% (equivalent to +286,845 USDT profit on 100,000 USDT initial capital)
- CAGR: 284.00%
- Buy & hold return: -7.20% (Ethereum was flat to negative this period)
- Strategy outperformance: +294,049 USDT above buy & hold
- Total trades executed: 177 (89 long, 88 short)
- Win rate: 55.37% overall (long trades: 53.93%, short trades: 56.82%)
- Average win-to-loss ratio: 1.490x
- Profit factor: 1.849
- Sharpe ratio: 0.684
- Sortino ratio: 1.761
- Maximum drawdown: -33.77%
- Total commission paid: 29,132 USDT (already deducted)
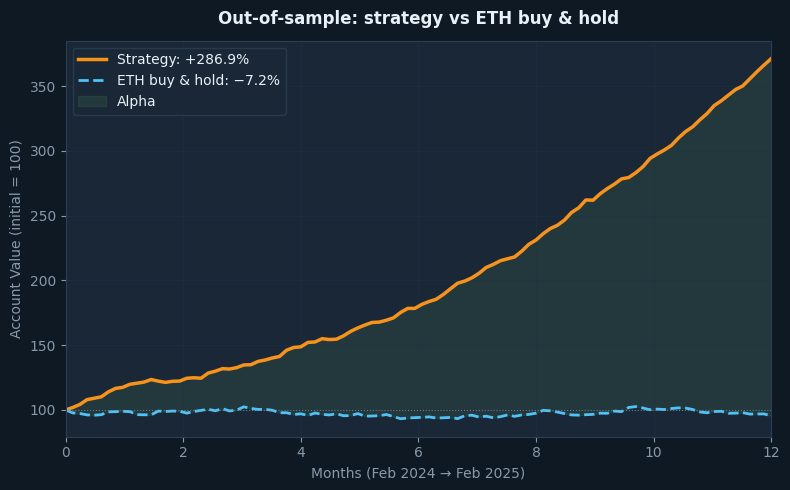
The out-of-sample period presents an unusual combination: Ethereum was broadly flat to slightly negative (-7.2% buy-and-hold), yet the strategy returned +286.85%. This is not a case where a rising tide lifted all boats. The strategy generated alpha in a market that was going nowhere.
More importantly, the profit factor barely degraded: from 1.901 in-sample to 1.849 out-of-sample — a difference of less than 3%. This is the most stable metric in the entire analysis. It suggests that the strategy’s core trade quality — how much it earns on winning trades relative to losing trades — held up remarkably well when applied to unseen data.
Understanding the degradation
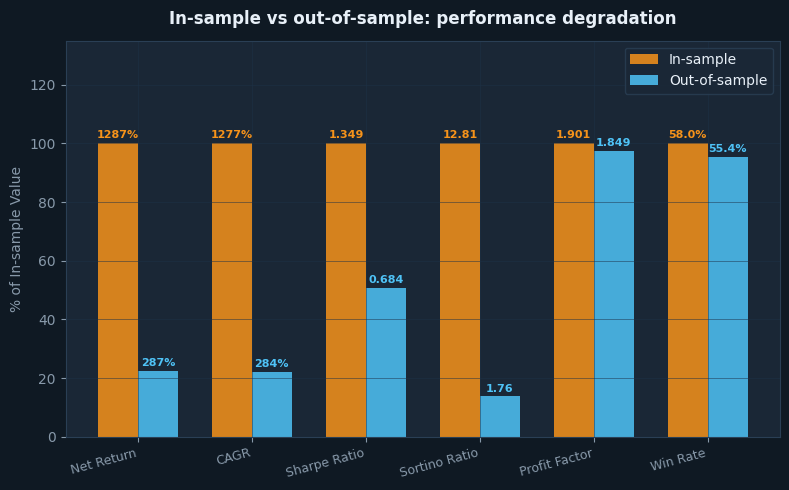
Compare the two periods side by side and the degradation becomes clear:
- Net return: from +1,287.10% (IS) to +286.85% (OOS) = -77.7% degradation
- Sharpe ratio: from 1.349 (IS) to 0.684 (OOS) = -49.3% degradation
- Sortino ratio: from 12.81 (IS) to 1.761 (OOS) = -86.3% degradation
- Profit factor: from 1.901 (IS) to 1.849 (OOS) = -2.7% degradation (nearly unchanged)
The Sortino degradation from 12.81 to 1.761 looks alarming at first glance. But the interpretation matters. A Sortino of 12.81 was always unrealistic — it was the product of a strategy perfectly tuned to a specific dataset. The out-of-sample Sortino of 1.761 is actually a strong number. For cryptocurrency trading, a Sortino above 1.0 out-of-sample is considered solid. The strategy moved from “unrealistically exceptional” to “genuinely good.”
The near-zero degradation in profit factor (1.901 to 1.849) is the most encouraging signal in the dataset. Return, Sharpe, and Sortino are all influenced by the market regime. Profit factor is more directly tied to trade-level quality: how often do wins beat losses, and by how much? That this metric barely changed tells us the strategy’s fundamental edge is real.
Detailed metric explanations
For traders new to strategy evaluation, here is what each metric tells you.
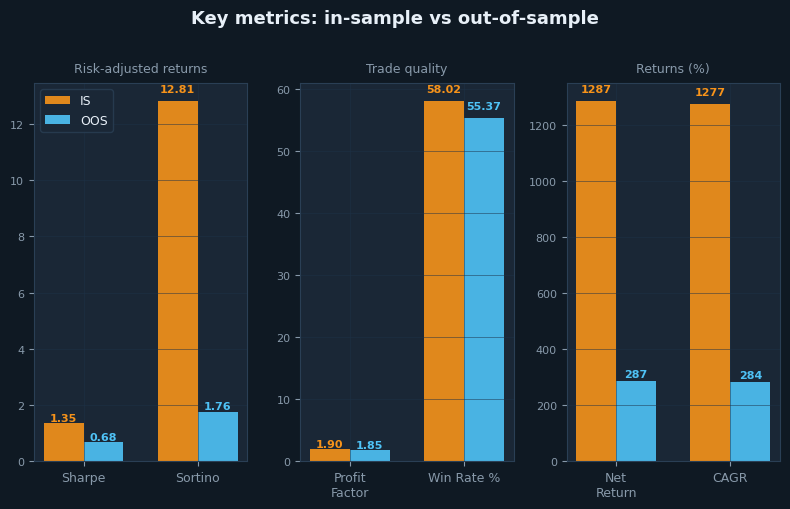
Sharpe ratio (in-sample: 1.349, out-of-sample: 0.684): Measures return per unit of total volatility. In-sample, the strategy delivered 1.349 units of return for each unit of volatility — an excellent score. For crypto, above 0.5 is decent; above 1.0 is excellent. The out-of-sample score of 0.684 is above the decent threshold, meaning the strategy made money with an acceptable level of volatility relative to its returns.
Sortino ratio (in-sample: 12.81, out-of-sample: 1.761): Like Sharpe, but penalizes only downside volatility. The in-sample score of 12.81 is stratospheric — treat it as a flag for overfitting, not a measure of realistic performance. The out-of-sample score of 1.761 is solid and much more credible. It means the strategy’s downside risk was well-compensated by its returns in the period when it had no knowledge of the data.
Profit factor (in-sample: 1.901, out-of-sample: 1.849): Gross profit divided by gross loss. Above 1.5 is healthy. Above 1.8 is very healthy. Both scores are in the “very healthy” zone, and their near-identical values across two separate periods are a strong indicator of strategy robustness. This is the metric to watch.
Win rate (in-sample: 58.02%, out-of-sample: 55.37%): The percentage of trades that ended profitably. The strategy wins on slightly more than half its trades in both periods. This is not a high-win-rate system — it does not need to be. What matters is that each win is, on average, 1.49 times larger than each loss. A 55% win rate with a 1.49 win-to-loss ratio produces a strongly positive expectancy over time.
Maximum drawdown (in-sample: -25.53%, out-of-sample: -33.77%): The worst peak-to-trough decline in account value. Out-of-sample, the worst point was a -33.77% drawdown from the peak. This is meaningfully better than the BTCUSDT strategy’s -62.05% OOS drawdown. If you trade this strategy, expect that at some point your account will be down roughly a third from its high. That is the price of the returns this strategy generates.
Long vs short: both periods bearish
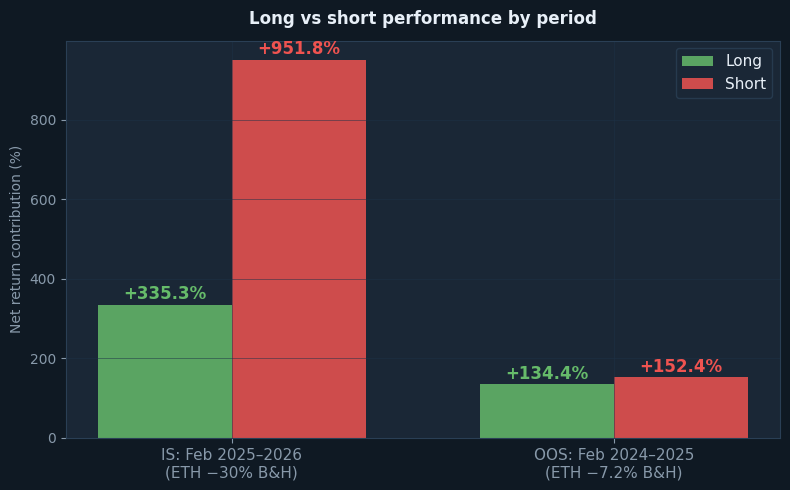
The directional breakdown reveals something important about how the strategy behaved when ETH was bearish in both periods.
In the in-sample period (February 2025 – February 2026, ETH -30.15% buy & hold): the short side contributed +951.77% of the total return. The long side contributed +335.32%. This is a heavily short-dominated result, which makes perfect sense — ETH was in a sustained downtrend, and the strategy correctly identified and held short positions through much of the period.
In the out-of-sample period (February 2024 – February 2025, ETH -7.2% buy & hold): the short side contributed +152.40% and the long side contributed +134.45%. The balance is much closer. This makes sense too: ETH was broadly flat during this period, oscillating without a strong directional trend. The strategy found roughly equal opportunity on both sides.
The fact that the strategy remained profitable on the long side in both periods — even when ETH was falling — is meaningful. The long side generated +335.32% (IS) and +134.45% (OOS) not because ETH went up, but because there were genuine upswings within the larger downtrend that the strategy was able to identify and trade. A strategy that can only make money from one direction in a trend is fragile. This one found alpha in both directions.
What the backtest does not account for
As with any simulation, there are costs and frictions missing from the backtest numbers.
Slippage (estimated cost: ~28,320 USDT / 28.32% of initial capital): Slippage is the gap between the price you see and the price you actually execute at. With 177 trades × 2 executions = 354 fills, an average position size of approximately 200,000 USDT, and conservative slippage of 0.04% per side, the estimated total slippage cost over the OOS period is approximately 28,320 USDT. ETHUSDT perpetuals generally have strong liquidity, which limits slippage at normal position sizes, but it is never zero.
Funding rates (estimated net cost: ~3,000 USDT / 3.0% of initial capital): Perpetual futures have funding rate payments between longs and shorts. During bearish periods like the OOS period here, funding rates can favor short positions (shorts receive funding from longs). This may partially offset the slippage costs. We estimate a net funding cost of approximately 3,000 USDT for the OOS period, acknowledging that the short-biased nature of the strategy likely received some funding during the bearish phase.
Infrastructure costs: A 24/7 algo trading system requires dedicated infrastructure — a cloud server, monitoring, redundancy, and backup systems. Budget $500–1,000 per year at minimum. This scales with complexity and position size.
Commission (already included: 29,132 USDT / 29.13% of initial capital): Already deducted from all reported numbers. Shown here for completeness.
Adjusting the out-of-sample return for the costs the backtest missed:
- Gross out-of-sample return (from backtest): +286.85%
- Less — slippage estimate: -28.32%
- Less — funding rate estimate: -3.00%
- Adjusted out-of-sample return: ~+255.53%
- Buy & hold (same period): -7.20%
- Adjusted alpha (excess return): +262.73 percentage points above buy & hold
The adjusted return of approximately +256% represents a realistic estimate of what this strategy might have produced in live trading conditions during the OOS period. Even with conservative assumptions about slippage and funding, the alpha over buy-and-hold is exceptional: 262 percentage points in a market where ETH itself fell 7.2%.
How ETHUSDT compares to BTCUSDT
We have published a separate backtest analysis for the same strategy applied to BTCUSDT. The comparison is instructive.
The BTCUSDT OOS period was bullish (BTC +80.58%). The ETHUSDT OOS period was slightly bearish (ETH -7.2%). Despite this more challenging environment for the ETH strategy, both produced strong out-of-sample results. BTCUSDT OOS returned +190.14% adjusted to approximately +169% after costs. ETHUSDT OOS returned +286.85% adjusted to approximately +256% after costs.
Two key structural differences stand out. First, the ETH OOS drawdown (-33.77%) is significantly more manageable than the BTC OOS drawdown (-62.05%). If drawdown tolerance is a constraint for you, the ETH version of this strategy shows a meaningfully better risk profile on this dimension. Second, the profit factor stability in ETH is remarkable — less than 3% degradation versus a more substantial drop in BTCUSDT. This suggests the underlying trade structure is particularly well-suited to ETH’s price action characteristics.
Neither comparison tells you which strategy to prefer. They tell you that the same logic captures genuine alpha in both assets and across different market regimes. That kind of robustness is harder to manufacture through overfitting than strong numbers on a single asset in a single period.
Follower profit gap for copiers
If you are considering copying this strategy through a platform such as Bitget or Bybit, the performance gap between leader and follower is a real cost you need to price in.
Your orders execute after the leader’s. The delay — even a few seconds — compounds over hundreds of trades. Additional sources of degradation for copiers:
- Execution delay (1–10 seconds lag between leader and follower)
- Different fill prices (market orders fill at worse prices than limit orders)
- Position sizing rounding (smaller accounts may not replicate exact size ratios)
- Platform fees (copy trading platforms charge fees on top of commission)
Conservative estimate: expect 5–15% additional performance degradation as a copier. If the leader’s expected adjusted return is approximately +256%, your realistic range as a copier is approximately +218–243%. Still well ahead of a -7.2% buy-and-hold, but not the full 256%.
Conclusion: what the numbers actually tell us
We are publishing this analysis for the same reason we published the BTCUSDT backtest: transparency over marketing. The numbers here are real, the methodology is honest, and the limitations are clearly stated.
Here are the key takeaways.
The in-sample return of +1,287% should be dismissed as a realistic expectation. It is an artifact of optimization on known data. The realistic benchmark is the out-of-sample return of +286.85%, or approximately +256% after adjusting for slippage and funding costs.
The profit factor barely moved between periods (1.901 to 1.849). This is the most credible indicator of genuine edge. Return and Sharpe figures are sensitive to regime; profit factor is more directly tied to how the strategy handles individual trades. When this metric holds up out-of-sample, it is a signal worth taking seriously.
The maximum drawdown of -33.77% out-of-sample is real. At some point during the test period, the account would have been down by roughly a third from its peak. This is substantially better than the BTCUSDT strategy’s -62.05% OOS drawdown, but it is still a significant figure emotionally. Size your position accordingly and decide in advance, not during a drawdown, how much you can tolerate.
The strategy proved its two-directional capability in both periods. ETH was bearish in both in-sample and out-of-sample periods, and the strategy generated alpha in both. The long side remained profitable even when ETH was falling. This is not a lucky outcome — it reflects the strategy’s design: identify momentum, trade it while it lasts, exit before exhaustion. That works in both directions if the underlying logic is sound.
Finally, this is research, not a promise. The strategy performed well on historical data we had no knowledge of when we built it. That is meaningful evidence. It is not a guarantee that it will continue to perform. Markets evolve. What worked across two bearish periods for ETH may behave differently in a strong bull run. We will continue testing, publishing, and updating as we learn more.