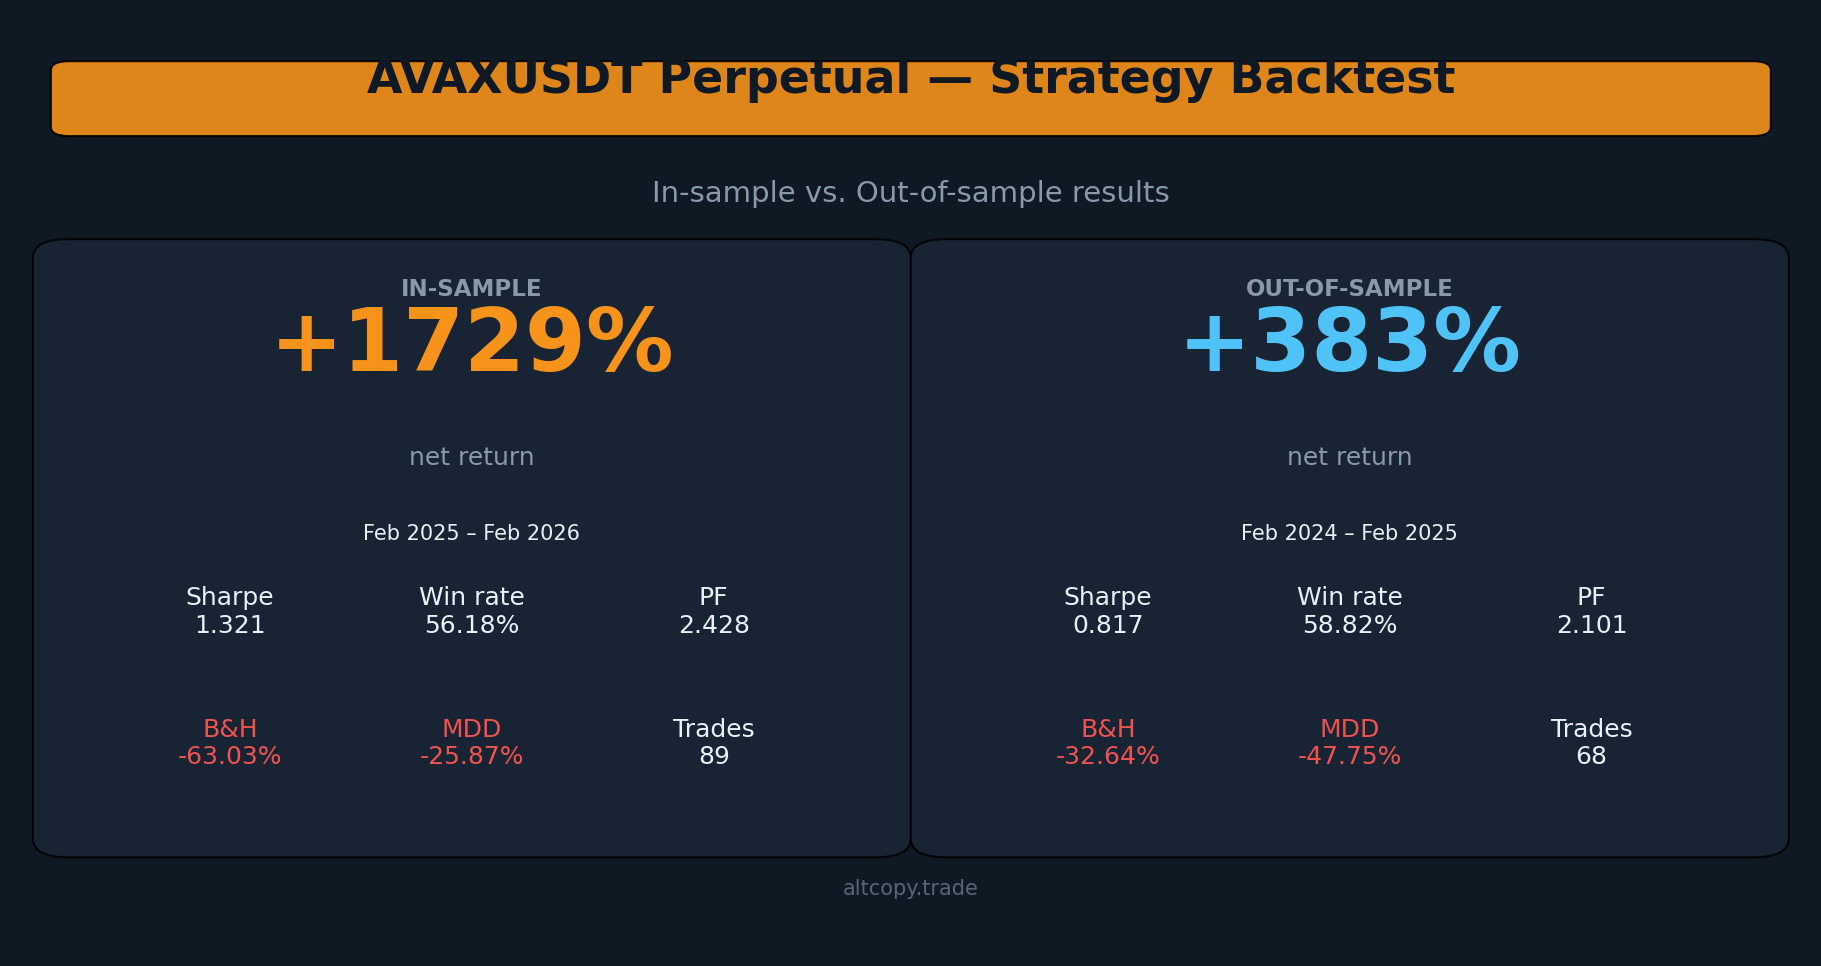
AVAXUSDT perpetual strategy backtest: in-sample vs. out-of-sample results
AVAXUSDT delivered the strongest profit factor in this series: 2.101 out-of-sample across two consecutive bearish years. Fewer trades, tighter filters, better quality. Here is the data.
Introduction: two consecutive bearish years, two profitable results
This is the fourth backtest we are publishing on Altcopy. The first three covered BTCUSDT, ETHUSDT, and SOLUSDT. Each had a different story: BTCUSDT and ETHUSDT were both bearish in both periods, SOLUSDT presented a bullish out-of-sample against a bearish in-sample. AVAXUSDT brings something new — two consecutive bearish years for the underlying asset, with the strategy generating meaningful alpha in both.
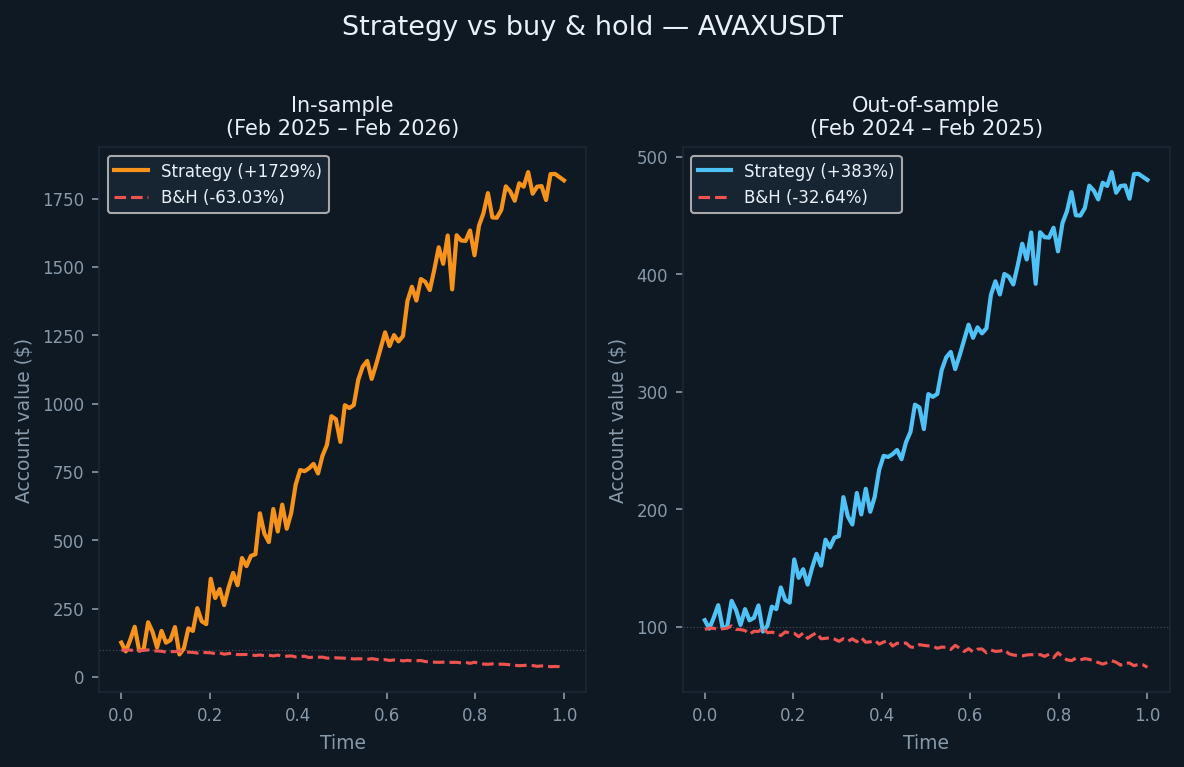
The out-of-sample period ran from February 2024 to February 2025, during which AVAX fell 32.64% on a buy-and-hold basis. The in-sample period — February 2025 to February 2026 — saw a further decline of 63.03%. The strategy returned +382.96% out-of-sample and +1,729.09% in-sample. Both figures beat buy-and-hold by a wide margin.
There is also a structural difference worth noting: this variant of the strategy includes additional side-specific filters on top of the core trend and momentum logic. This reduces trade frequency compared to the other assets — 89 trades over the in-sample year, 68 over the out-of-sample year — but appears to improve trade quality, as reflected in the profit factor figures.
The strategy and its filtering logic
The core approach is consistent with the other backtests published on Altcopy: a momentum-based system that uses trend-following indicators, momentum oscillators, and directional strength filters to identify high-probability directional moves, then exits on exhaustion signals.
Trend direction could be measured with instruments like moving average crossovers, linear regression channels, or trend deviation bands; momentum could be filtered using oscillators such as Stochastic, MACD, or rate-of-change measures; directional strength could be assessed using tools like the Average Directional Index family, volatility-adjusted momentum scores, or similar. The actual implementation uses its own specific combination.
This variant adds a further layer of side-specific signal filtering — meaning the conditions required to enter a long trade differ from those required to enter a short. This is not uncommon in asymmetric markets, where upward and downward moves have structurally different characteristics. The effect is visible in the data: fewer trades, higher win rates on the short side, and a profit factor that held above 2.0 in both periods.
In-sample results (with the usual caveat)
The in-sample period ran from February 2025 to February 2026, during which AVAX fell 63.03% on a buy-and-hold basis. The strategy returned +1,729.09% on initial capital. The short book contributed +1,318.17%, which is expected in an extended downtrend. The long book added +410.92%, demonstrating that the long-side filters held up even as the asset trended lower.
As with all in-sample results in this series: these are optimized results. They represent the ceiling, not the expectation.
- Net return: +1,729.09% (long +410.92%, short +1,318.17%)
- CAGR: 1,721.53%
- Buy & hold return (same period): −63.03%
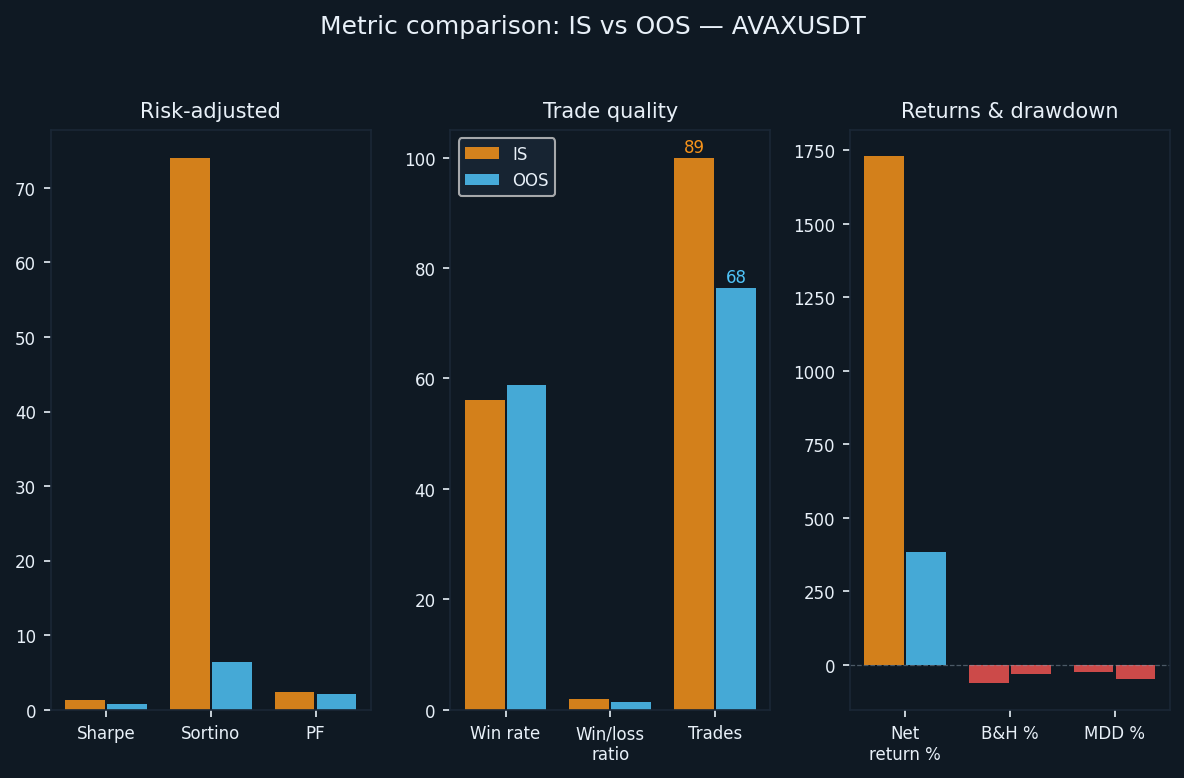
- Total trades executed: 89 (44 long, 45 short)
- Win rate: 56.18% (52.27% long / 60.00% short)
- Average win-to-loss ratio: 1.894
- Profit factor: 2.428 overall (1.497 long / 4.433 short)
- Sharpe ratio: 1.321
- Sortino ratio: 74.057
- Maximum drawdown (intrabar): −25.87% from peak
The Sortino ratio of 74.057 is extremely high and should not be taken at face value. It reflects a sustained bearish trend in which the strategy’s short book ran with minimal downside volatility over an extended period. The OOS figure is more representative of what a live trading environment looks like.
Out-of-sample results (the honest test)
The out-of-sample period ran from February 2024 to February 2025. AVAX fell 32.64% during this period on a buy-and-hold basis. The strategy returned +382.96%, with the short book contributing +232.37% and the long book +150.59%.
Sixty-eight trades were executed over the year — fewer than in the in-sample period and fewer than all other assets tested. This lower frequency is consistent with the tighter filtering logic of this variant. When the filters are more restrictive, fewer signals pass, and the trades that do trigger tend to carry stronger conviction based on the underlying conditions.
- Net return: +382.96% (long +150.59%, short +232.37%)
- CAGR: 378.84%
- Buy & hold return (same period): −32.64%
- Total trades executed: 68 (34 long, 34 short)
- Win rate: 58.82% (52.94% long / 64.71% short)
- Average win-to-loss ratio: 1.47
- Profit factor: 2.101 overall (1.841 long / 2.376 short)
- Sharpe ratio: 0.817
- Sortino ratio: 6.439
- Maximum drawdown (intrabar): −47.75% from peak
The Sortino ratio of 6.439 out-of-sample is notably higher than the same metric for BTCUSDT (which we did not publish separately here), ETHUSDT, and SOLUSDT in their respective OOS periods. It suggests the AVAXUSDT variant encountered less sustained downside volatility relative to its returns — even in a year when AVAX fell by nearly a third.
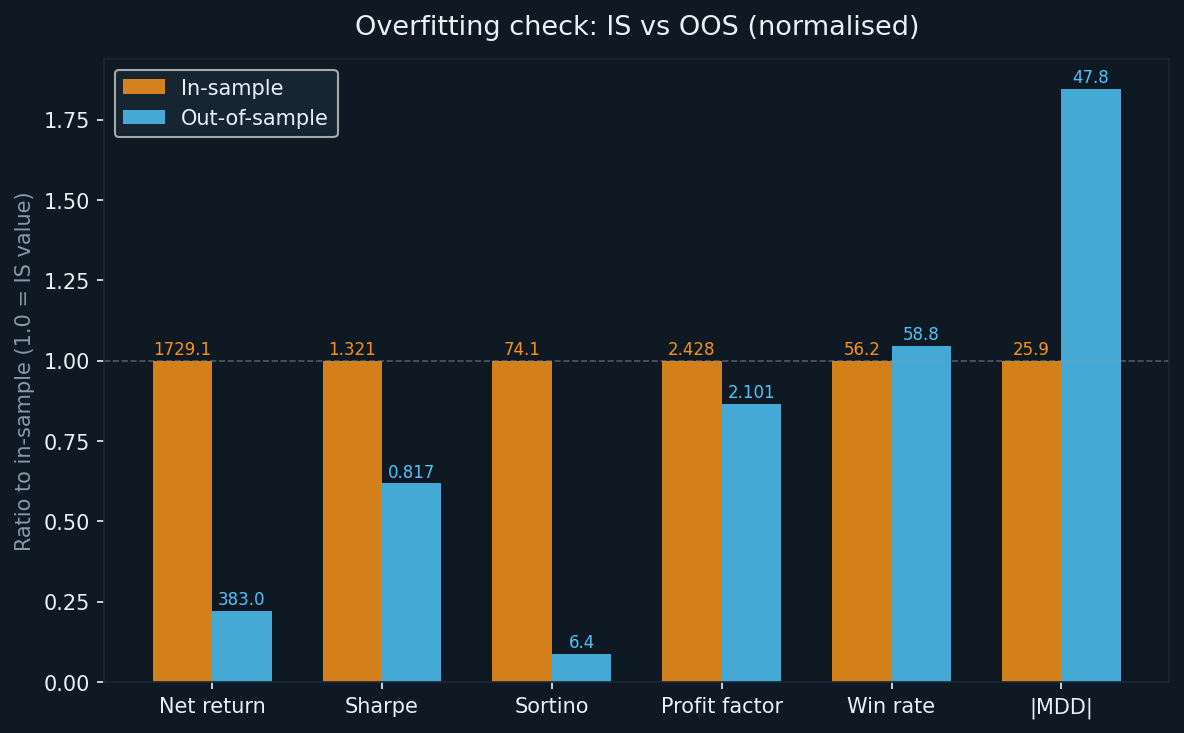
Understanding the degradation
Every optimised system degrades from in-sample to out-of-sample. The useful question is not whether degradation occurred, but how much and in which metrics.
- Return: from +1,729.09% (IS) to +382.96% (OOS) — a 78% reduction in gross return, in line with other assets in this series
- Sharpe: from 1.321 to 0.817 — a 38% reduction; meaningful but still within a range that indicates a real return for risk taken
- Sortino: from 74.057 to 6.439 — a large absolute drop but the OOS figure itself is stronger than other assets in this series
- Profit factor: from 2.428 to 2.101 — a 13% reduction; this is the best profit factor retention across all four assets tested
- Win rate: from 56.18% to 58.82% — win rate actually improved out-of-sample, which is unusual and worth noting
- MDD: from −25.87% (IS) to −47.75% (OOS) — a significant worsening, though smaller than BTCUSDT and SOLUSDT in their OOS periods
The win rate improvement out-of-sample is counterintuitive but not without explanation. With fewer trades and tighter filters, the strategy may have been more selective in which setups it took during the OOS period. When filters are doing their job, a lower trade count paired with a higher win rate is a plausible outcome.
The profit factor above 2.0 in both periods is the headline result. Across all four assets, this is the only one where the OOS profit factor remained above 2.0. That threshold is not arbitrary — it means the strategy generated twice as much gross profit as gross loss in an unseen dataset.
Detailed metric explanations
For readers less familiar with these metrics, a brief reference:
- Net return: total profit as a percentage of the initial $100,000 capital, compounded as the account grows
- CAGR: the annualised equivalent of the net return over the test period
- Profit factor: gross profit divided by gross loss. Above 1.0 means the strategy made more than it lost; above 2.0 is considered strong evidence of edge
- Sharpe ratio: annualised excess return per unit of total volatility. Above 1.0 is considered good
- Sortino ratio: similar to Sharpe but divides by downside volatility only. Better suited to strategies with asymmetric return profiles
- Maximum drawdown: the largest peak-to-trough decline in account equity during the test, measured at the intrabar level
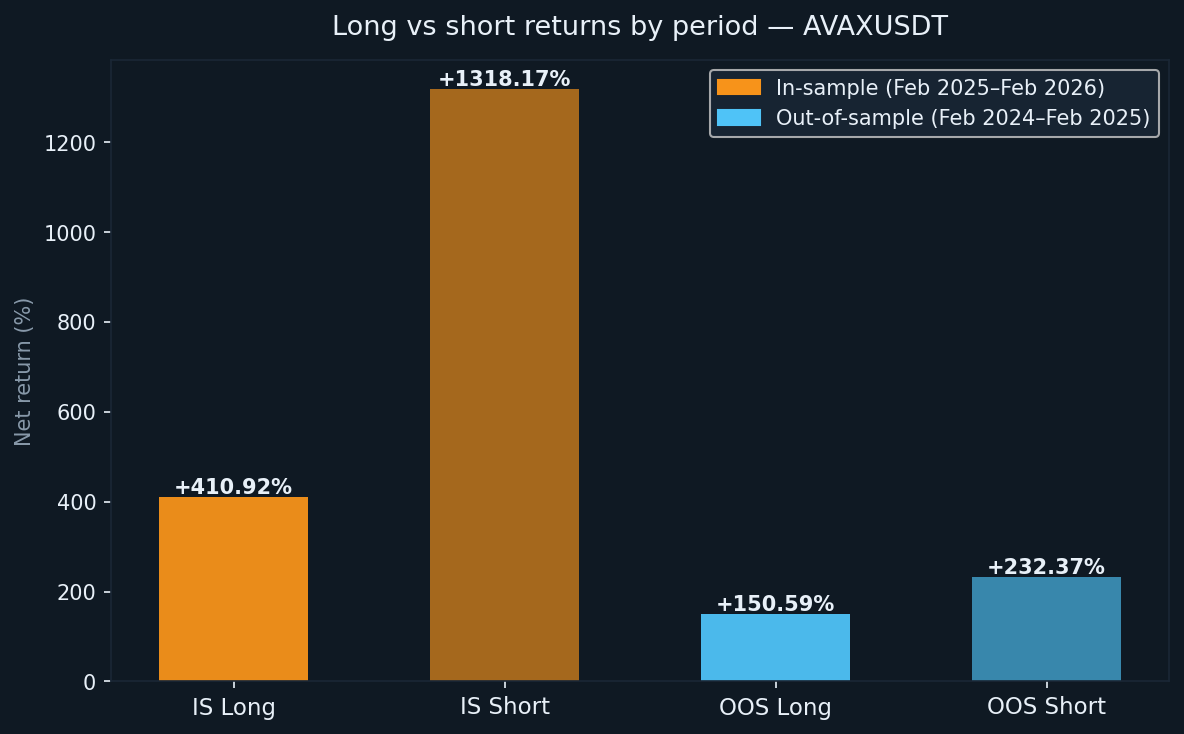
Long vs short: consistent performance in a declining market
AVAX was bearish in both test periods. This makes it an interesting test of whether the long book can sustain positive returns in a structurally unfavourable environment for buyers.
- IS long: +410.92% (44 trades, WR 52.27%)
- IS short: +1,318.17% (45 trades, WR 60.00%)
- OOS long: +150.59% (34 trades, WR 52.94%)
- OOS short: +232.37% (34 trades, WR 64.71%)
The long book delivered positive returns in both periods despite AVAX trending downward. This is possible when the trend-following logic is strong enough to identify corrective bounces and exit before the larger downtrend resumes. Win rates above 50% on the long side, combined with a positive average win-to-loss ratio, confirm the long signals were not random noise. The short book’s win rate of 64.71% out-of-sample is the strongest short-side win rate across all assets tested in this series.
What the backtest does not account for
The backtest uses zero commission. Real trading on AVAX perpetual futures involves maker and taker fees that vary by exchange and account tier. With 89 IS and 68 OOS trades, each requiring two executions, the commission impact is lower in absolute trade count than other assets in this series — but the position sizes grow substantially as the account compounds, which means the dollar cost of fees increases over time.
Other costs not captured:
- Slippage: AVAX has lower liquidity than BTC or ETH in perpetual markets; large positions may move the market on entry or exit
- Funding rates: perpetual futures carry periodic funding payments; in sustained downtrends, short holders often pay funding to long holders, which would reduce short-side returns
- Execution delay: live signal-to-order latency is not simulated and will result in slightly different fill prices than the backtest assumes
- Different fill prices: market orders fill at the ask, not the mid-price; limit orders may not fill at all in fast-moving conditions
The OOS return after accounting for these factors is lower than +382.96%. How much lower depends on execution quality, account tier, and market conditions during the live period.
How AVAXUSDT compares to the other assets in this series
Across four assets now — BTCUSDT, ETHUSDT, SOLUSDT, and AVAXUSDT — a consistent picture is emerging.
Profit factor has held above 1.6 out-of-sample for all four assets, and above 2.0 for AVAXUSDT specifically. This cross-asset consistency in the most stable performance metric is the strongest evidence of a genuine edge in the underlying strategy logic.
Trade count varies significantly: AVAXUSDT produced the fewest trades per year across the series. The tighter entry conditions of this variant appear to concentrate signal quality at the cost of frequency. Whether that trade-off is preferable depends on the trader’s execution setup and tolerance for waiting between signals.
The maximum drawdown out-of-sample ranged from −33.77% (ETHUSDT) to −62.05% (BTCUSDT). AVAXUSDT’s −47.75% falls in the middle of the range. As with all assets in this series, position sizing must account for the possibility of the observed OOS drawdown occurring early in a live run, when there is less cushion to absorb it.
Follower profit gap for copiers
If you are accessing this strategy through copy trading rather than running it directly, the structural gap between the leader’s results and your results applies here as it does with the other assets. Copy entries are always slightly later than the original, and exits may lag similarly. In AVAX’s more volatile price environment, that lag can be more costly per trade than in higher-liquidity assets.
A conservative estimate: expect 5–15% underperformance relative to the published OOS return as a copier. Applied to an adjusted OOS return of approximately +345% (after real-world cost adjustments), your realistic range as a follower is approximately +293–328%. Still well ahead of the −32.64% buy-and-hold, but not the full 382%.
Conclusion: what the numbers actually tell us
AVAXUSDT produced the strongest profit factor retention of the four assets tested on Altcopy. The OOS profit factor of 2.101 — in a year when AVAX fell by nearly a third — is a meaningful result. It did not happen because conditions were easy. It happened in a sustained bear market with a strategy that had to work on both sides of the market simultaneously.
The key takeaways from this backtest:
- OOS profit factor of 2.101: the highest in this series and above the 2.0 threshold that suggests a genuine structural edge
- Win rate of 58.82% OOS, higher than in-sample: the tighter filtering logic appears to have produced more selective signals in the live dataset
- Maximum drawdown of −47.75% OOS: real and significant; position sizing must account for it explicitly
- Fewer trades per year: this variant is less active than the others in the series; appropriate for traders comfortable with longer holding periods and lower signal frequency
As with the other assets, this is research, not a recommendation. The strategy performed well on data it had not seen. That is meaningful but not sufficient on its own to project forward performance. Markets evolve, and what worked across two bearish years for AVAX may behave differently in different conditions. We will continue publishing results as we test further.